
Chrome HTTP debugging and HAR export
burstHAR
A Chrome extension for developers, QA testers, and support engineers who need to capture page HTTP requests, API calls, fetch and XHR traffic, replay calls, and export clean HAR files.
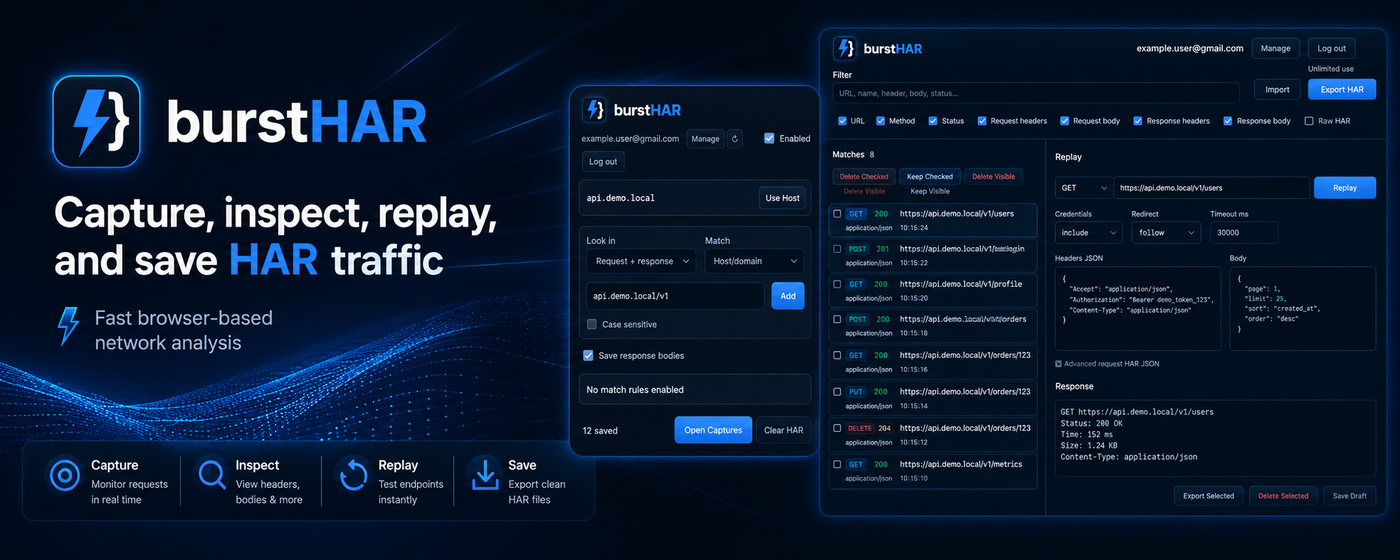
Overview
burstHAR helps web developers, QA teams, and technical support users capture the exact browser HTTP requests they care about without leaving Chrome. Save matching page requests, API calls, fetch() traffic, and XMLHttpRequest traffic, inspect request headers, response bodies, status codes, and timing details, then export the result as a HAR file for debugging or sharing.
Use the toolbar popup to turn monitoring on, add match rules for a host, full URL, request payload, response payload, or phrase, then open the burstHAR captures workspace to review captured requests in one place.
It is useful for reproducing frontend bugs, checking HTTP and API responses, comparing request payloads, testing authenticated endpoints, and collecting browser network evidence before sending a bug report.
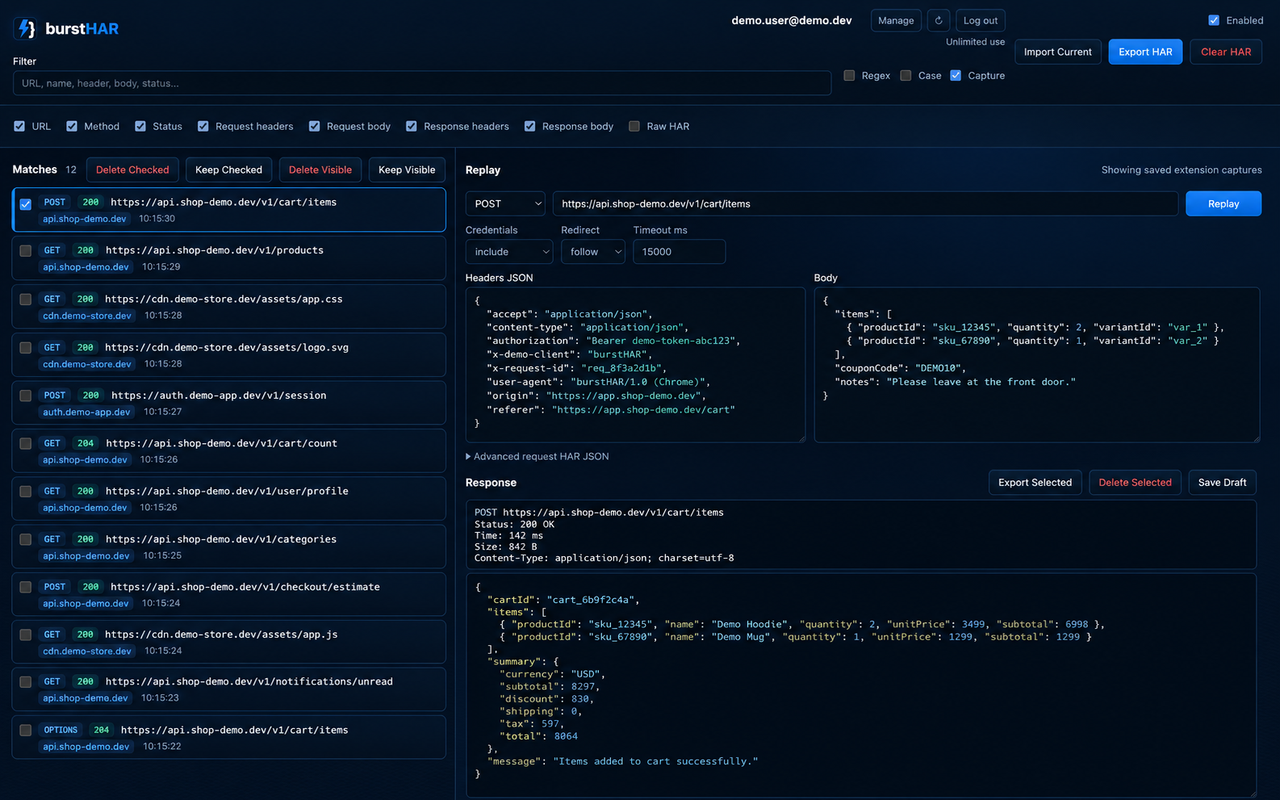
- Capture matching HTTP requests from pages you choose, including page requests, API calls, fetch() traffic, and XMLHttpRequest traffic.
- Match by URL, request data, response data, or request plus response content.
- Save request headers, bodies, response metadata, and optional response bodies.
- Filter captures by URL, method, status, headers, body text, or raw HAR content.
- Edit method, URL, headers, body, credentials mode, redirect mode, and timeout before replaying.
- Export one capture or the full capture set as a HAR file without attaching Chrome's debugger.
Privacy note: captured request and response data is stored locally in your browser profile only. burstHAR is intended for debugging your own websites, applications, and accounts.